Channel A/B Testing Ideas for Marketers, with a Six Point Checklist
11/03/2026
Marketing Strategy
Discover high-impact A/B testing ideas across marketing channels and learn how to prioritize experiments, validate results, and increase conversions.

This article gives you a prioritized set of A/B testing ideas grouped by channel, from landing pages to checkout to email, plus the prioritization framework and statistical guardrails that keep results honest. Run the tests in order of impact, score them with ICE or RICE before you build anything, and follow the six-point checklist before you call a winner. Do that, and you get experiments that actually hold up.


A/B Testing Ideas by Channel: Where to Start



Most experimentation programs fail not because the ideas are bad, but because teams test low-impact tweaks first and burn traffic they never get back. Start with the elements that touch the biggest share of your funnel, then work down. Below is a channel-by-channel breakdown of the highest-leverage split testing ideas, organized by where they sit in the customer journey.
Landing pages
Landing pages are usually the highest-traffic, highest-stakes real estate you own, which makes them the natural starting point for any A/B testing strategy.
• Value proposition: test a specific outcome-led headline against a feature-led headline; measure qualified submissions or purchase conversions.
• Primary CTA: compare a direct action label (such as “Book a demo”) with a softer offer (such as “See how it works”) while keeping page layout unchanged.
• Form friction: test the minimum required fields against the existing form and use qualified-lead rate as a guardrail.
• Proof placement: move a customer quote or case-study result beside the CTA and track conversion without changing the claim itself.
• Page structure: compare a concise hero-first layout against a detailed explanation for visitors who need more evaluation context.
Product pages
• Product imagery: test a use-in-context hero photo against a product-only image; evaluate add-to-cart and purchase rate.
• Benefit hierarchy: test a short benefit-first opening against a technical-spec-first opening.
• Offer communication: compare pricing or shipping information above the fold against its current placement.
• Social proof: test a concise review summary near the purchase action against a lower-page placement.
• Variant selection: test size or package choices with clearer default states and explanatory labels.
Checkout
Checkout tests carry outsized weight because even small drop-off reductions compound across every order.
• Guest checkout: compare requiring account creation with offering guest checkout; watch order completion and account creation separately.
• Shipping transparency: show estimated shipping and total costs earlier, keeping fulfillment terms the same.
• Payment options: test displaying eligible payment methods sooner in the checkout sequence.
• Progress feedback: compare a clear step indicator with the current flow in a multi-step checkout.
• Field and error design: test address autocomplete or inline validation; monitor error frequency and completed orders.
Email and SMS
• Subject or preview text: change one of them at a time and judge performance by clicks or downstream conversions, not opens alone.
• Single CTA: compare one prominent action with multiple competing links, measuring the intended completion event.
• Email sequence timing: compare behavior-triggered follow-ups against the current cadence while watching unsubscribes.
• Offer framing: test benefit-led versus urgency-led copy without changing the actual offer.
• SMS brevity: test a short action-specific message against a longer explanation; monitor conversions and opt-outs.
Ads and creative
• Opening hook: compare a problem-first line with an outcome-first line while holding audience and offer constant.
• Creative format: compare a static demonstration with a short video only when platform experiment controls can keep delivery groups comparable.
• Proof style: test a quantified customer outcome against a general benefit claim, using only approved evidence.
• CTA or landing-page match: test a direct demo promise against an educational-resource promise, then evaluate lead quality as well as volume.
• Audience-sensitive diagnostics: check placement and demographic balance before attributing a win entirely to creative.
Mobile-specific tests
• Sticky CTA: compare an accessible sticky action with the standard in-page button; watch accidental clicks.
• Form input: test appropriate keyboards, autofill, and simpler field labels to reduce completion time.
• Navigation: compare a simplified mobile menu with the existing navigation for task completion.
• Media weight: test a lighter hero asset against a heavy image or video, tracking speed and conversion together.
• Tap targets: enlarge undersized buttons and spacing, then measure error taps and successful submissions.
Finding new ideas doesn’t have to start from a blank page. Combining heuristic reviews, funnel analytics, session replay, and direct customer feedback surfaces hypotheses that guesswork alone never would. Watch where users hesitate in session recordings, where funnel analytics show the steepest drop-off, and what your support team hears on repeat. Those three sources alone will generate more test ideas than most teams can execute in a quarter.
How to Prioritize A/B Tests and Write a Hypothesis
Not every idea deserves a test slot. ICE (Impact, Confidence, Ease, each scored 1 to 10) is fast and good for weekly triage. RICE (Reach, Impact, Confidence, Effort) works better when you’re comparing tests across very different traffic segments, since it explicitly weighs how many people a change touches. A practical rule: anything scoring above roughly 7 out of 10 on ICE, or landing in the high-impact, high-ease quadrant of a simple prioritization grid, goes first. Low-impact, low-ease ideas get dropped, not queued.
Before you build anything, define your minimum detectable effect (MDE), the smallest lift you actually care about catching, and pick one overall evaluation criterion (OEC) as your primary metric. Add one or two guardrail metrics (bounce rate, refund rate, unsubscribe rate) so a “win” on the primary metric can’t hide damage elsewhere.
A pre-registered hypothesis keeps the team honest once results come in. Use a simple template:
Hypothesis template: Because [evidence about a user problem], changing [one specific element] from [control] to [variant] for [audience] will improve [one primary metric] by at least [minimum meaningful lift] within [predefined test window], without worsening [guardrail metric].
Example: Because mobile visitors abandon the demo form at the phone field, making phone optional will increase qualified demo submissions by a pre-agreed meaningful amount without reducing sales acceptance rate.
Pro Tip: Estimate time-to-signal before you commit. Divide your required sample size by your average daily traffic to that page. If the math says fourteen weeks and your team can’t wait that long, don’t shrink the sample. Raise the MDE, pick a bigger swing, or choose a metric further up the funnel that moves faster.
Reach and confidence should scale together. A change on your homepage justifies a smaller MDE because traffic is high; a change on a low-traffic pricing page for an enterprise tier needs a much bigger swing to ever reach significance.
The Statistical Checklist That Keeps Your Results Honest
A documented hypothesis and a sample-size calculation done before launch is the single biggest predictor of whether a test result can be trusted. Skip it, and you’re gambling, not testing.
A smaller relative lift, say 1% instead of 10%, can require an order of magnitude more traffic to prove statistically. That’s the math most teams underestimate when they schedule a two-week test on a low-traffic page.
Baseline conversion rate and MDE together determine your required sample size. A page converting at 2% needs far more visitors to detect a one-point lift than a page converting at 20%. Run the calculation before you build the variant, not after the data starts trickling in.
Peeking, checking results daily and stopping the moment you see significance, inflates your false-positive rate dramatically. If your team wants to monitor tests in progress without that risk, sequential testing with always-valid p-values is the legitimate alternative, but it has to be configured before the test starts. You cannot bolt it on retroactively once you’ve already been peeking.
Before declaring any winner, run through this six-point checklist:
1. Pre-register the hypothesis. Record the target audience, the one primary metric, expected direction, minimum detectable effect, decision rule, and guardrails before launch.
2. Validate instrumentation. Confirm event tags fire once, attribution is consistent, both variants render correctly, and an A/A or smoke test reveals no obvious measurement defects.
3. Calculate power and sample size. Base the planned sample on baseline rate, effect size, statistical power, and the number of comparisons; avoid promising a calendar-only end date.
4. Check assignment integrity. Verify the intended allocation and investigate sample-ratio mismatch or uneven device, source, or audience mixes before reading outcomes.
5. Respect the stopping rule. Do not stop merely because a dashboard flashes significance; complete the predefined fixed-horizon design or use a valid sequential method chosen in advance.
6. Assess business impact and document the result. Check the primary outcome, uncertainty interval, guardrail changes, segment consistency, and rollout plan. Log wins, losses, and inconclusive outcomes.
If most of your users are returning visitors with rich historical data, CUPED-style variance reduction can shrink the noise in your metric and let you detect real effects with a smaller sample. It’s worth the setup effort for high-traffic programs running frequent tests.
Free Brand Health Audit
Make sure your brand is built to sell
Search has changed. Your customers aren't just Googling anymore. They're asking ChatGPT, Perplexity, Gemini and other AI platforms what to buy, who to trust and which brands they should consider.
If your brand isn't showing up clearly in those answers, you're already losing opportunities. Our free Brand Health Audit shows you where your brand stands across traditional search, AI search and brand positioning.

Sample brand audit
Live preview
Traditional search
72
AI search (GEO)
34
Brand positioning
58
Running Effective A/B Tests When Traffic Is Low




Low-traffic sites face a hard truth: you cannot reliably detect small lifts without volume, so micro-optimizations rarely produce a clean read. A bold structural change doesn’t.
Pair every quantitative test with qualitative research, session replays, and direct user interviews, so you’re validating direction before you spend engineering time building a variant that traffic alone can’t judge fairly.
• Prioritize high-impact changes: test a different offer, funnel step, or core proposition before testing minor button or color variations.
• Use a larger practical effect threshold and calculate required sample size before launch; report inconclusive tests as inconclusive.
• Combine similar traffic only when segments are genuinely comparable, rather than mixing markets or device groups that behave differently.
• Use usability tests and interviews to improve low-volume pages when a controlled A/B test cannot reach enough traffic in a useful timeframe.
What Agency Experimentation Programs Get Right
Patterns repeat across successful testing programs: clear, single-metric hypotheses, proper event tracking before launch, coordinated rollout across teams, and guardrail metrics defined up front. Where an outside partner adds the most value is in the parts teams skip under deadline pressure. That includes designing tests with real statistical power, wiring up instrumentation correctly the first time, and mapping a winning variant into a full rollout plan instead of letting it sit in a dashboard as a “win” nobody implements.
A/B Test Case Studies Worth Studying
Large-scale experimentation programs prove that simple changes can produce outsized results when they’re run and replicated correctly. One well-documented example: a headline and layout change at Bing produced a 12% revenue lift in a replicated experiment, a result large enough that it initially looked like a data error before the team confirmed it held up.
The lesson isn’t “copy that specific change.” It’s that companies running thousands of experiments a year build the infrastructure to catch surprising wins and verify them before rolling them out broadly. That means sample-ratio mismatch checks to confirm traffic split correctly, A/A tests to validate the testing tool itself isn’t introducing bias, and staged ramp-ups that expose a new variant to 5% of traffic before going to 50%.
Smaller companies rarely have the volume to run thousands of tests a year, but the discipline scales down fine. Document every test, win, loss, or inconclusive, in a shared experiment log. A null result on a headline test still tells you something: that audience doesn’t respond to urgency framing, so stop trying variations of it and test a different lever instead. Teams that skip documentation end up re-testing the same failed idea eighteen months later because nobody remembers it already lost.
Want to learn more about Digital Marketing and Strategy? Keep reading!
If you need help with your company’s marketing, contact us for a free custom quote.
Why Most Testing Programs Underperform Their Potential
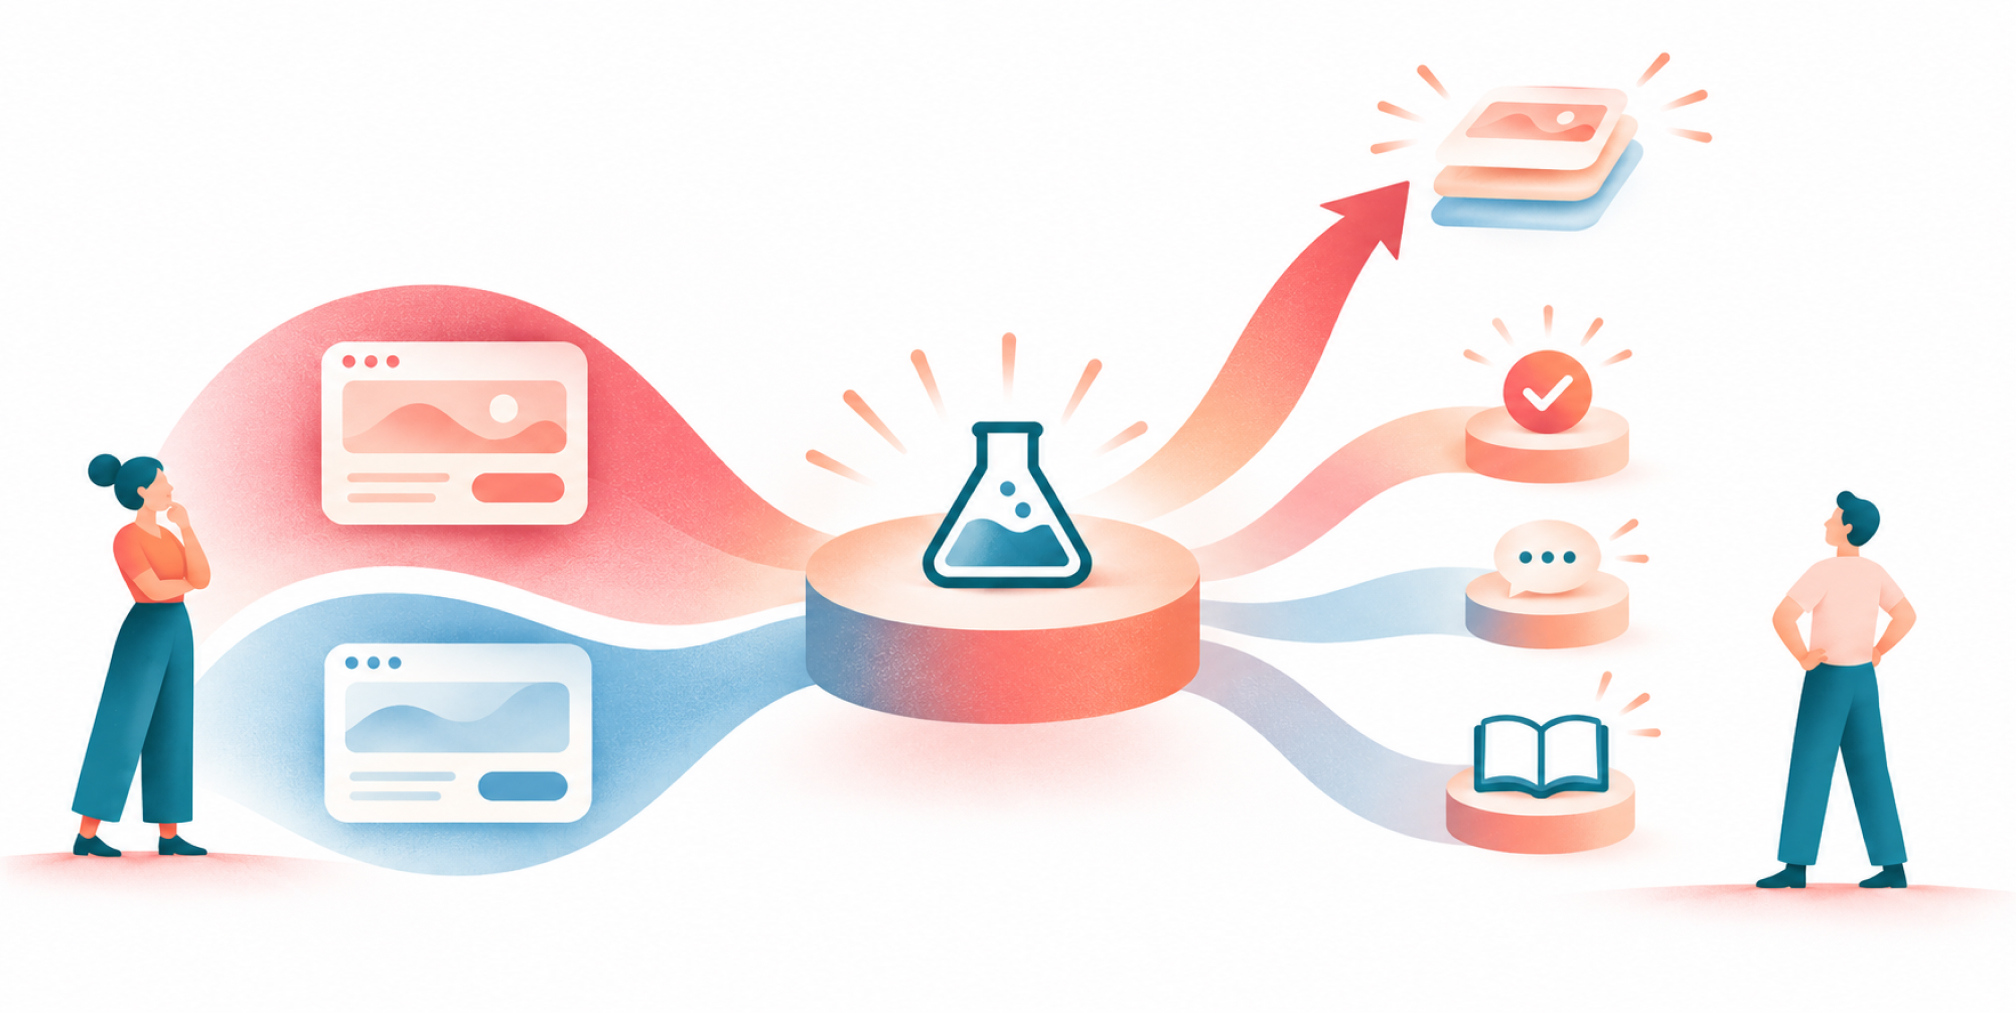
The conventional advice on A/B testing spends too much time on statistical mechanics and not nearly enough on idea quality. You can run a statistically flawless test on a change nobody was ever going to notice, and you’ll get a flawless null result that taught you nothing worth knowing.
What the research actually supports is a sequencing problem: most teams test in the wrong order. They start with headline color and button copy because those are easy to build, and they get to structural changes, checkout flow, pricing presentation, only after months of inconclusive noise. Flip that order. Spend your first real sample size on the change most likely to matter, even if it takes a full sprint to build, not the change you can ship by Friday.
The other gap is documentation. Teams treat a losing test as wasted effort instead of a data point that rules out an entire category of future ideas. A testing log that nobody reads is worse than useless. It gives false confidence that the program is rigorous when it’s really just busy.
Managed A/B Testing Support From The Branded Agency
Running a disciplined testing program on top of a full marketing calendar is where most in-house teams stall out, not because the ideas run dry, but because nobody owns the instrumentation, the prioritization, or the follow-through on a winning variant. The Branded Agency builds that infrastructure as part of its conversion rate optimization services, so your team gets a running experimentation program instead of a one-off test here and there.
That work includes CRO program setup, hypothesis workshops that turn analytics and session data into a prioritized backlog, and analytics instrumentation that makes sure your results are trustworthy before you ever declare a winner. For teams running paid traffic alongside testing, the agency’s paid media management work ties ad-variant testing directly into landing page performance instead of treating them as separate workstreams.
If you’re weighing whether to build this in-house or bring in a partner to run it alongside you, start a conversation with The Branded Agency about what a structured testing program would look like for your current traffic and team size.
Frequently Asked Questions

What are some common topics for A/B testing?
The most common topics are headlines and value propositions, CTA copy and placement, form length, checkout flow, pricing presentation, and email subject lines, since these elements sit closest to the conversion decision.
What are some examples of successful A/B testing experiments?
A documented example is a headline and layout change at Bing that produced a 12% revenue lift once replicated and verified, showing that simple changes can produce outsized results when tested rigorously.
What are the main types of A/B testing?
The main types are classic A/B (two versions, one variable), multivariate testing (multiple variables at once), and split-URL testing (entirely different page designs), plus sequential testing for teams that need to monitor results as they run.
What does a test market mean in A/B testing?
A test market is a defined audience segment, often a geographic region or a percentage slice of traffic, used to trial a change before rolling it out to everyone; it works the same way as a staged ramp-up used in large-scale experimentation programs.
How long should an A/B test run?
A test should run until it hits its pre-calculated sample size and has covered at least one full business cycle, typically one to two weeks minimum, rather than stopping on a fixed calendar data

Quincy Samycia
As entrepreneurs, they’ve built and scaled their own ventures from zero to millions. They’ve been in the trenches, navigating the chaos of high-growth phases, making the hard calls, and learning firsthand what actually moves the needle. That’s what makes us different—we don’t just “consult,” we know what it takes because we’ve done it ourselves.
Want to learn more about brand platform?
If you need help with your companies brand strategy and identity, contact us for a free custom quote.
We do great work. And get great results.
+2.3xIncrease in revenue YoY
+126%Increase in repurchase rate YoY



+93%Revenue growth in first 90 days
+144% Increase in attributed revenue




+91%Increase in conversion rate
+46%Increase in AOV



+200%Increase in conversion rate
+688%Increase in attributed revenue