Customer Acquisition Cost: What It Really Costs to Win a Customer
11/09/2026
Marketing Strategy
Learn what it really costs to win a customer, including overlooked team and technology expenses, then identify ways to improve acquisition efficiency.
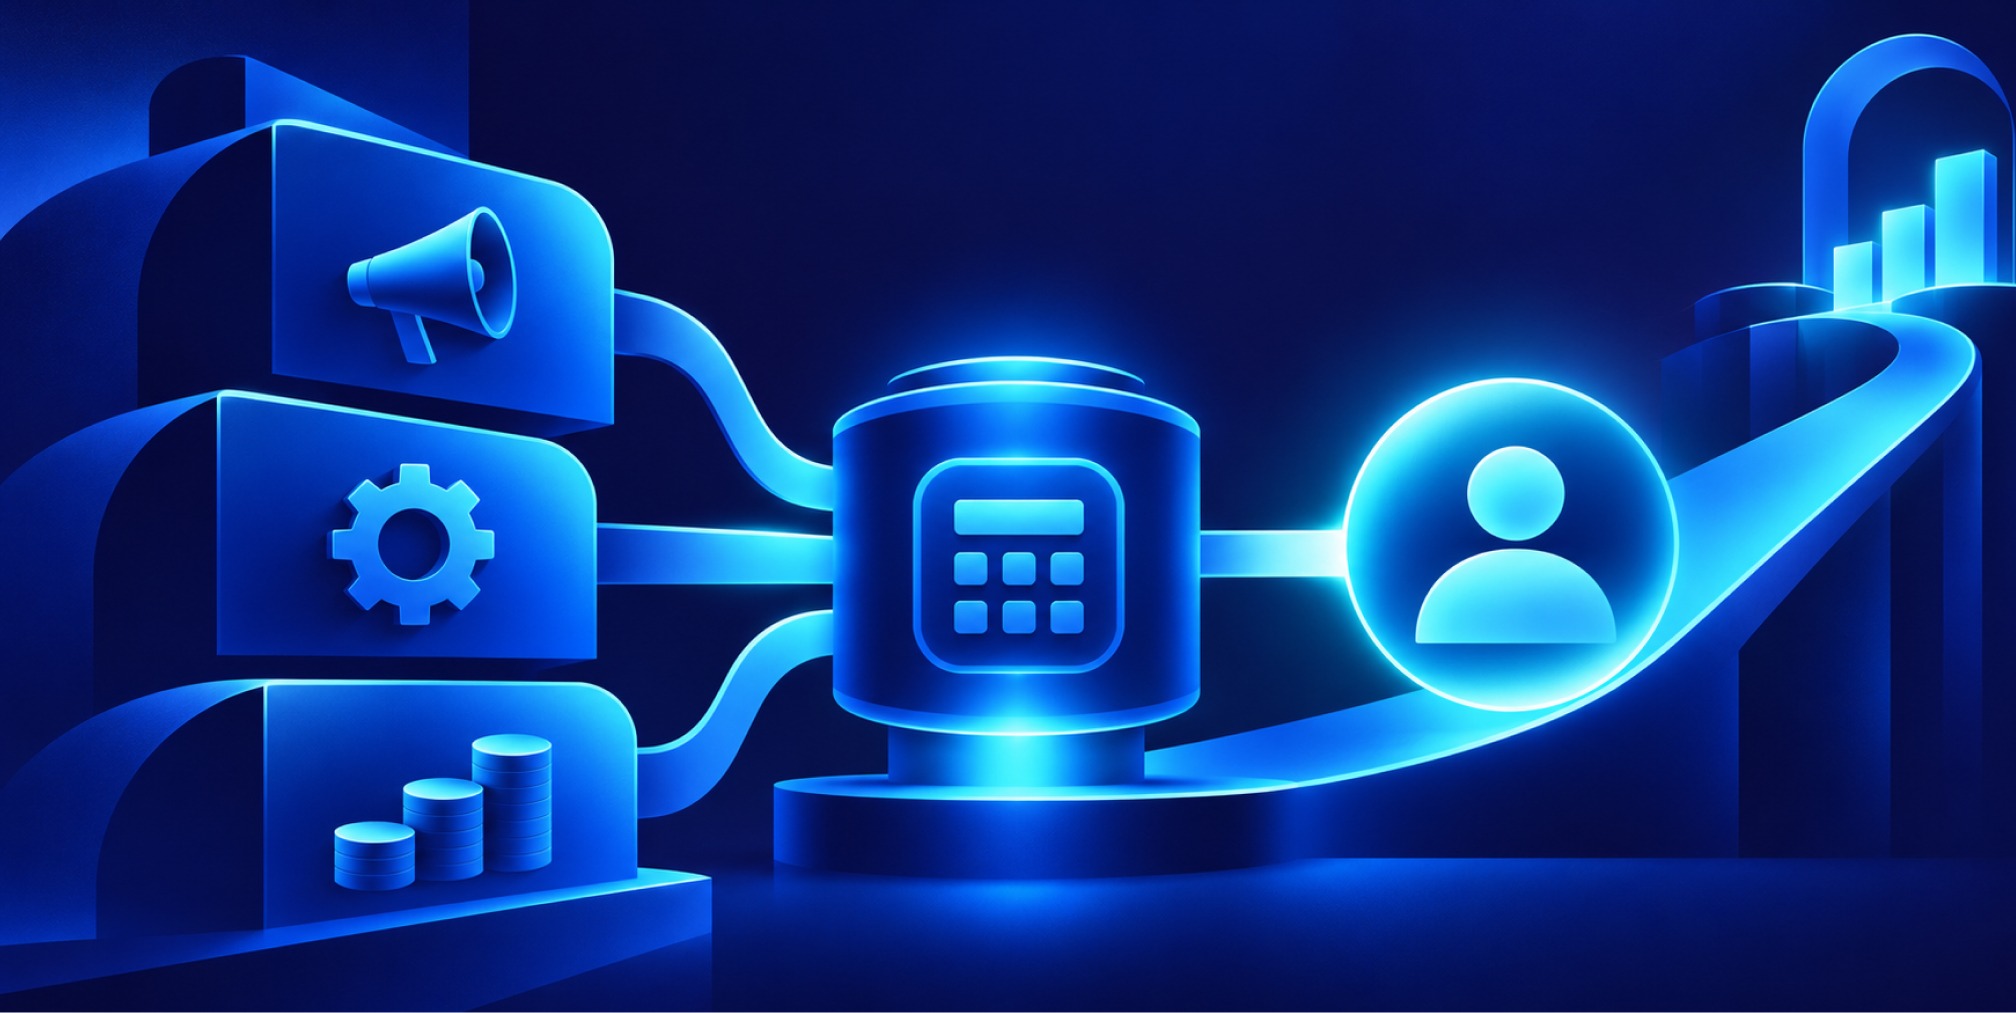
Customer acquisition cost (CAC) is your total sales and marketing spend divided by the number of new customers you win in a given period. A healthy business targets an LTV:CAC ratio around 3:1 with a payback period under 12 months. That’s the benchmark. Everything else in this guide exists to help you hit it.


What Is the Customer Acquisition Cost Formula?
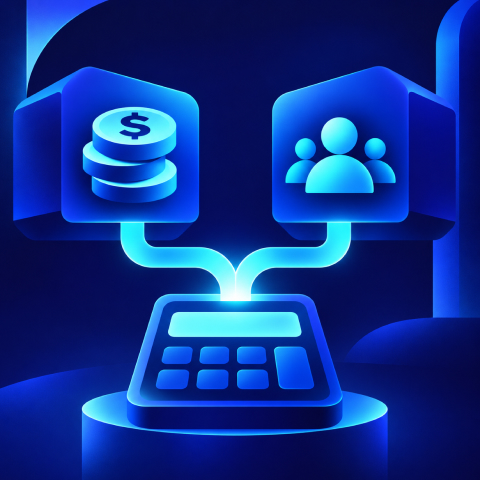


The base formula is simple: total sales and marketing expenses divided by the number of new customers acquired in that period. The complexity lives in what you put into “total expenses” and how you define the variant you’re calculating.
Here’s a worked example. Say your company spent $50,000 on paid ads, $15,000 on salaries for the marketing team working the funnel, $8,000 on agency fees, and $2,000 on tools and software in one quarter. That’s $75,000 in total spend. If you closed 150 new customers in that quarter, your CAC is $75,000 ÷ 150 = $500 per new customer.
Three variants matter for different decisions:
- Paid CAC: Paid acquisition expenses divided by customers attributed to paid channels; useful for channel operations, not total profitability.
- Blended CAC: Total acquisition spend divided by all new customers from paid and unpaid sources.
- Fully loaded CAC: Acquisition-related media, personnel, agency, software and allocated overhead divided by new customers; use for financial planning.
Most founders calculate paid CAC and stop there. That’s the mistake that gets exposed in due diligence.
What Should Go Into the CAC Numerator?
Your numerator needs to capture every dollar spent to win a customer, not just the media buy that’s easiest to export from an ad dashboard. Leave costs out and your CAC looks artificially healthy right up until a board member or acquirer recalculates it themselves.
Include these categories:
- Media spend and creative production for acquisition campaigns.
- Salaries, commissions and benefits attributable to winning new customers.
- Agency fees, lead-generation contractors and prospecting tools.
- Acquisition-related software, research and appropriately allocated overhead.
- Exclude retention-only activity or product costs, and document allocation assumptions.
For shared costs, like a marketing director who splits time between acquisition and retention, allocate based on a reasonable time or budget split rather than dumping the full salary into CAC or excluding it entirely. Product development costs stay out of the numerator; they belong in cost of goods sold, not acquisition cost.
Pro Tip: Pull your CAC from your finance system, not your ad platform. Platform dashboards routinely undercount true acquisition cost because they only see the media line, never the team and tooling behind it.
How Does CAC Connect to LTV and Payback Period?
CAC only means something in relation to what a customer is worth and how fast you recover the cost of winning them. Two metrics do that work: the LTV:CAC ratio and the CAC payback period.
LTV:CAC ratio divides customer lifetime value by acquisition cost. A ratio of 3:1 is the widely cited baseline for healthy growth economics. A ratio below 1:1 means you’re losing money on every customer. Curiously, a ratio above 5:1 isn’t automatically good news either. It often signals you’re underinvesting in growth and leaving market share on the table.
CAC payback period measures how many months of revenue it takes to recoup what you spent acquiring a customer. Under 12 months is the practical baseline for many growth-stage businesses, though the acceptable range shifts with your business model.
Investors increasingly build these thresholds into term sheets. Efficiency metrics like CAC payback and LTV:CAC now feature prominently in diligence conversations, not as a nice-to-have but as a gating requirement before capital moves.
Free Brand Health Audit
Make sure your brand is built to sell
Search has changed. Your customers aren't just Googling anymore. They're asking ChatGPT, Perplexity, Gemini and other AI platforms what to buy, who to trust and which brands they should consider.
If your brand isn't showing up clearly in those answers, you're already losing opportunities. Our free Brand Health Audit shows you where your brand stands across traditional search, AI search and brand positioning.

Sample brand audit
Live preview
Traditional search
72
AI search (GEO)
34
Brand positioning
58
What Are the 2026 CAC Benchmarks by Industry?
CAC is rising almost everywhere, and the causes are structural rather than cyclical. Auction inflation on major ad platforms, privacy changes like Apple’s App Tracking Transparency, and longer B2B sales cycles are all compounding at once. The result: customer acquisition cost has climbed roughly 60% since 2021 across benchmarked industries.
That headline number masks enormous variance by sector and motion. Benchmarks show wide swings by business motion: PLG and self-serve SaaS models generally have markedly lower CAC than sales-led enterprise motions, simply because the buying process requires far less human intervention.
Channel choice matters as much as industry. Organic acquisition typically runs substantially cheaper than paid channels., and referral programs frequently deliver the lowest CAC of any channel for consumer businesses. Meanwhile, platform-reported metrics routinely understate true, fully loaded CAC by a wide margin, which is exactly why the fully loaded variant matters more than whatever number your ads manager shows you on a Monday morning.
If you’re running paid social as part of your channel mix, it helps to understand how social media marketing costs stack up against the benchmarks above before you commit next quarter’s budget.
How Can You Reduce Customer Acquisition Cost?
- Improve landing-page conversion and qualification before raising media budgets.
- Identify segments with strong retention and contribution margin, then adjust targeting to find similar buyers.
- Test new messages and offers with controlled budgets, tracking total customer outcomes rather than platform clicks.
- Improve organic and referral acquisition where demand and economics support them.
- Audit onboarding and sales handoffs that cause qualified leads to drop out.
Lowering CAC rarely means spending less. It means spending smarter, and the highest-leverage lever isn’t where most teams look first.
The sequence matters. Fixing conversion and retention first means every dollar you eventually put toward paid acquisition works harder, rather than compensating for leaks you haven’t patched. For a broader set of tactics beyond this list, our guide on effective customer acquisition strategies for growing small businesses covers channel-specific plays in more depth.
Pro Tip: Before increasing ad budget on any channel, run a two-week conversion test on your primary landing page.
How Do You Measure CAC Without Fooling Yourself?
Bad CAC measurement produces confident, wrong decisions. The fix starts with cohorting: group customers by the month or quarter they were acquired, then track spend and revenue against that same window rather than mixing acquisition dates across periods.
For stakeholder reporting, present three numbers side by side every month: paid CAC, blended CAC, and fully loaded CAC, alongside the trailing LTV:CAC ratio. This structure was recommended in early attribution research emphasizing consistent measurement windows, and that same discipline still holds decades later. A tool like Hotjar or a comparable analytics platform can help you see where conversion breaks down inside the funnel you’re already measuring.
Want to learn more about Digital Marketing and Strategy? Keep reading!
If you need help with your company’s marketing, contact us for a free custom quote.
How Does Branding Fit Into Lowering Fully Loaded CAC?

Performance marketing and brand work are usually managed as separate budgets, which is precisely why fully loaded CAC keeps climbing. A stronger brand reduces the cost of every paid click because prospects convert faster once they land, trust the offer sooner, and need less retargeting to close.
We build acquisition strategy around this connection directly:
- Clarify differentiated positioning to reduce buyer confusion at the first touch.
- Align ad promise, landing-page proof and sales conversation to minimize conversion friction.
- Measure fully loaded CAC alongside retention and margin by acquisition cohort.
Build in-house when you have dedicated headcount and enough volume to justify specialized roles. Bring in an integrated agency when your team is stretched across branding, creative, and media buying without the bandwidth to optimize any one lever fully.
Why Fully Loaded CAC Changes the Conversation
Most CAC advice online still treats the metric as a media-buying scorecard. That’s the conventional wisdom this article pushes back against. The research is clear that platform-reported numbers understate true cost by a wide margin, and any founder or analyst reporting paid CAC alone to a board is, functionally, reporting an incomplete number.
What the evidence actually supports is a shift in priority: fix conversion and retention before scaling spend. A landing page conversion lift from 2% to 3% does more for blended CAC than most budget increases, and it costs nothing but time to test. That’s underrated. Everyone talks about channel mix and creative fatigue; almost nobody talks about the fact that your own website is usually the cheapest lever available.
Where branding fits is narrower than agencies often claim, but real: it compounds every dollar already in market by making conversion easier and retargeting less necessary. If your fully loaded CAC keeps climbing despite a clean paid media strategy, the gap is usually brand and conversion, not media buying. Start there before touching the ad account.
Frequently Asked Questions
How do you calculate customer acquisition cost?
Divide acquisition-related sales and marketing spend in a defined period by the number of new customers acquired on a consistent basis.
What is a good CAC?
There is no universal dollar benchmark. Evaluate CAC against contribution margin, retention, customer lifetime value and cash payback.
What is the difference between CAC and CPA?
CAC measures the cost of gaining a customer; CPA may measure any configured action, including a lead or signup.
Why is fully loaded CAC higher than ad-platform CAC?
It includes salaries, agency fees, tools and other costs the ad platform cannot observe.
Sources
- Shopify customer acquisition cost guide: https://www.shopify.com/blog/customer-acquisition-cost
- Google Analytics acquisition reports: https://support.google.com/analytics/answer/12923437
- U.S. Small Business Administration financial management: https://www.sba.gov/business-guide/manage-your-business/manage-your-finances
- Benchmarks and definitions above draw on Artisan Strategies’ 2026 industry CAC report, Corpify’s channel benchmarks, Improvado’s LTV:CAC guide, and the Wikipedia entry on customer acquisition cost for the base formula.

Quincy Samycia
As entrepreneurs, they’ve built and scaled their own ventures from zero to millions. They’ve been in the trenches, navigating the chaos of high-growth phases, making the hard calls, and learning firsthand what actually moves the needle. That’s what makes us different—we don’t just “consult,” we know what it takes because we’ve done it ourselves.
Want to learn more about brand platform?
If you need help with your companies brand strategy and identity, contact us for a free custom quote.
We do great work. And get great results.
+2.3xIncrease in revenue YoY
+126%Increase in repurchase rate YoY




+93%Revenue growth in first 90 days
+144% Increase in attributed revenue




+91%Increase in conversion rate
+46%Increase in AOV




+200%Increase in conversion rate
+688%Increase in attributed revenue